show molecule
Syntax
showmol(atoms,coordinates)

showmol(...,style)

showmol(...,style,option1,option2,...,optionN)

showmol(ax,...)

[axout,atoms_patch,bonds_patch]=showmol(...)
Description
showmol(atoms,coordinates) uses array atoms (N-by-1) and matrix coordinates (N-by-3) to display molecule.
showmol(...,style) uses style defined by style to display molecule. style should be one of ‘ball & stick’(default), ‘space filling’ and ‘tube’.
showmol(...,style,option1,option2,...,optionN) uses style defined by style and options defined by option1,option2,...,optionN to display molecule. option can be chosen from ‘normal’(default), ‘noh’(do not show hydrogen) and ‘labels’(show atoms’ labels). If you do not want to specify style, you can use showmol(...,'',option).
showmol(ax,...) shows molecule in ax.
[axout,atoms_patch,bonds_patch]=showmol(...) returns axout which molecule are displayed in and two cell which contain faces and vertices of atoms’ and bonds’ surface.
Warning: if style is specified as ‘space filling’, showmol() will not create bonds thus bonds_patch will be 0-by-1 cell.
Examples
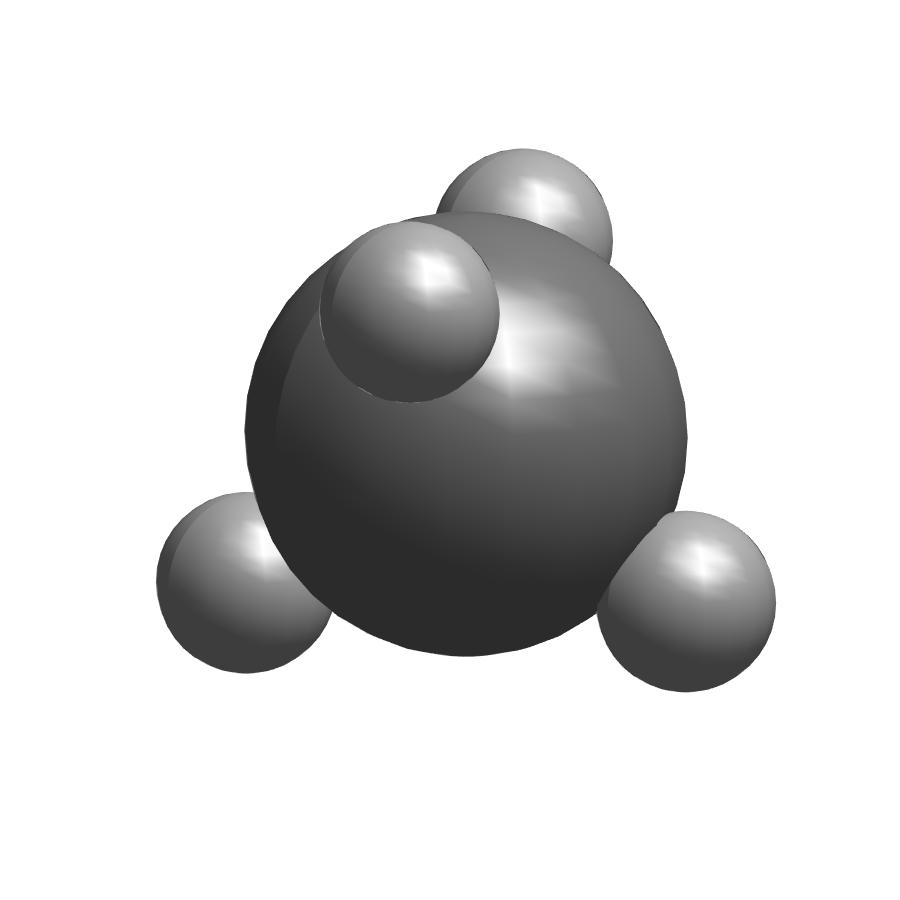
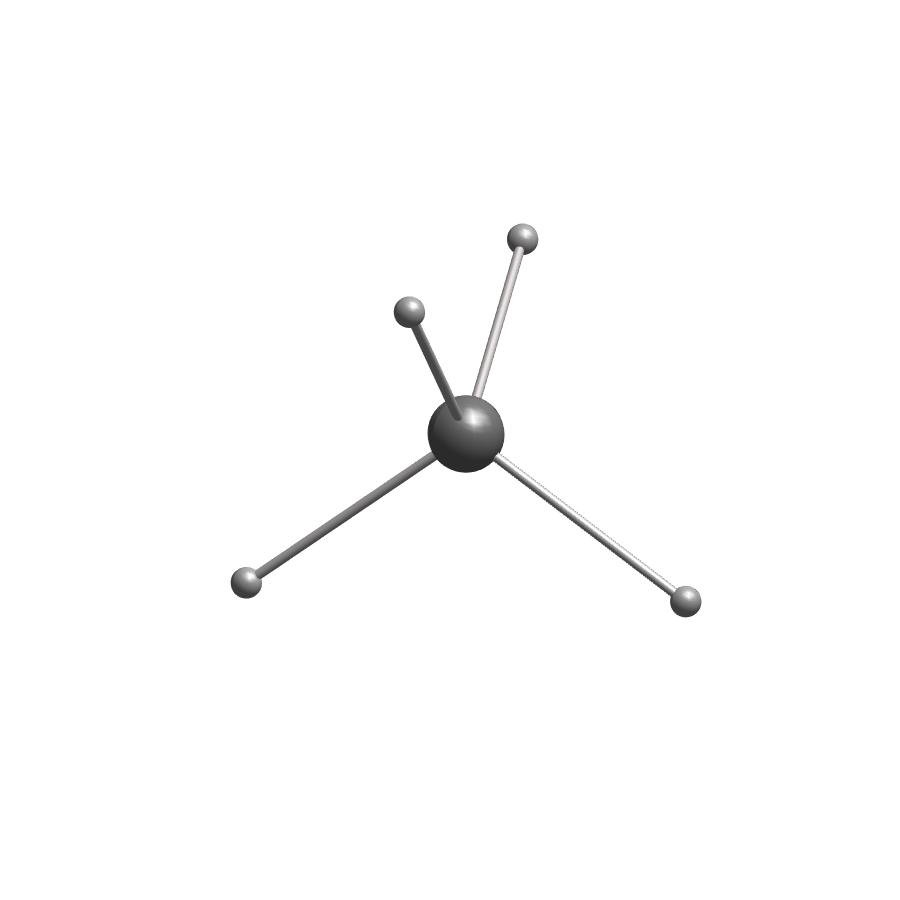
show methane molecule by atoms and coordinates
atoms=[6;1;1;1;1];
coordinates=[0         , 0         , 0         ;...
             0.62957749, 0.62957749, 0.62957749;...
            -0.62957749,-0.62957749, 0.62957749;...
            -0.62957749, 0.62957749,-0.62957749;...
             0.62957749,-0.62957749,-0.62957749];
showmol(atoms,coordinates);
change style to ‘space filling’ to display space filling model of methane.
showmol(atoms,coordinates,'space filling');